
Capital goods are defined as products used to manufacture other goods and services
(see more here).
It is common knowledge that the capital goods new orders indicator is closely related to investments in the economy
(see more here).
But how do we really use it for forecasting investments? A brief simplified guide is below.
Methodology. Time series to be used are the US gross private investments and new orders for nondefense capital goods excluding aircraft (NDEA capital goods). Just to show the basic understanding of how the two indicators interact graphical analysis and simple regression analysis will be employed. While the investments data is quarterly, the capital goods series takes the first month of the quarter as the data point
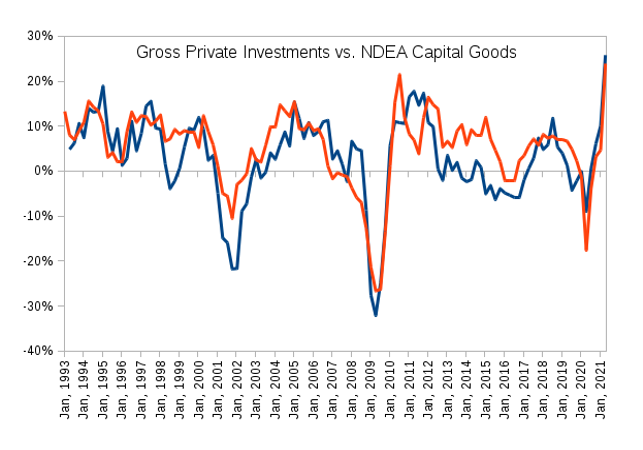
Graphical analysis. In order to avoid looking at autocorrelated series (in general words, autocorrelation is when each data point is highly correlated with the previous one) the data were transformed using the 1st difference, i.e. year-over-year growth rates were calculated. Looking at the chart one can easily see how close the two series move over time.
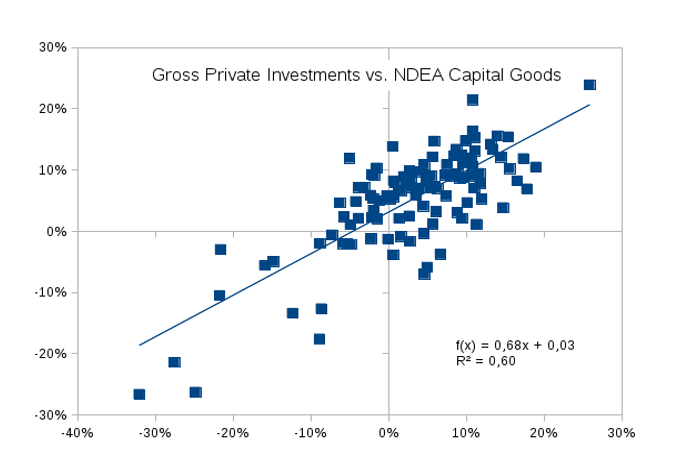
Regression analysis. More formal modeling requires applying some more advanced techniques. For example, a simple regression can be run with the two data series. The chart below shows a one-factor regression of NDEA capital goods on the gross private investments. It is clear that there is a connection and that it is quite close. Furthermore, with the equation also estimated it can be used to calculate actual forecasts of investments in the future based on the capital goods' new data points.
To conclude it is important to mention
that only the basic analytic tools were applied here
just to show how formal methods can be used in practical forecasting.
Further analysis requires steps in the following directions:
- confirming that the 1st month of the quarter is the best data point to use (2nd or 3rd months could be used or an average of the three);
- understanding how the series are reacting to using lags (months or quarters backward);
- checking the overall robustness of the simple regression equation (residuals examination, removing possible outliers, etc.);
- adding more factors that can potentially influence investments (interest rate, inventories, etc.).